


Building modern web applications often involves using powerful JavaScript frameworks like React, Angular, and Vue.js. These frameworks make it easier to develop dynamic and interactive applications, allowing developers to focus on building rich user experiences rather than reinventing the wheel. However, as applications grow in complexity, they also become more prone to performance issues — one of the most common being memory leaks in JavaScript frameworks.
A memory leak occurs when a program doesn’t properly release memory that it no longer needs, causing unnecessary data to accumulate over time. In a JavaScript context, this means that certain objects or functions may stay in memory longer than they should, leading to slower performance as the application runs.
In the early stages of development, small memory leaks in JavaScript might not be noticeable. But as your app gets larger and more complex, the impact of these leaks becomes much more apparent. Memory leaks in JavaScript frameworks can cause sluggishness, freezing, and even crashes. This can make an app feel unreliable or unresponsive, ultimately frustrating users.
Memory leaks are particularly problematic in modern JavaScript applications because they can severely degrade user experience. Users today expect smooth, seamless interactions, and even a slight lag can cause frustration. Additionally, on devices with limited resources — like mobile phones or lower-end laptops — memory leaks can be even more damaging, affecting both the app’s speed and battery life.
This article will guide you through identifying and fixing memory leaks in JavaScript, focusing on popular frameworks like React, Angular, and Vue.js. We’ll explore common causes of memory leaks in front-end frameworks, offer tips on how to detect memory leaks in React, Angular, and Vue.js, and provide practical solutions to prevent memory leaks and keep your projects running smoothly. By the end, you’ll have a solid understanding of how to prevent memory leaks and maintain optimal performance as your applications grow.
Understanding Memory Leaks in JavaScript Frameworks
What is a Memory Leak?
In simple terms, a memory leak happens when an application keeps using up memory without releasing it when it’s no longer needed. This leads to wasted memory, and over time, it can cause your application to slow down, freeze, or even crash. In a JavaScript application, memory leaks typically occur when objects, variables, or resources are unintentionally retained in memory even though they are no longer being used.
Imagine your web app is like a house with a lot of rooms. Each time you load a new feature or page, the app is like putting items (data, variables, objects) into those rooms. When you’re done using a room, you should “clean it up” and remove anything inside, so it’s ready for the next use. If you forget to clean up the rooms and leave items there, the house starts filling up with junk, eventually making it harder to move around and slowing down everything.
In a JavaScript app, the garbage collector is responsible for this cleanup process. It automatically frees up memory when objects are no longer referenced by your program, making the process seamless most of the time. However, when your app keeps referencing objects that should no longer be in use (known as “dangling references”), the garbage collector can’t clean them up, and that’s where memory leaks occur.
How JavaScript Handles Memory (Brief Overview on Garbage Collection)
JavaScript has a built-in system known as garbage collection to manage memory. The garbage collector’s job is to automatically track and free up memory that is no longer needed by the application. It does this by identifying objects or values that are no longer accessible or referenced by your code. These objects are considered “garbage,” and once they are identified, the garbage collector removes them, thus freeing up memory.
This process happens behind the scenes and is generally efficient, but it is not perfect. In some cases, due to poorly managed references or cyclic dependencies (when two or more objects reference each other in a loop), the garbage collector may not be able to detect that an object is no longer needed. This leads to memory leaks, where memory is not properly released.
JavaScript uses reference counting and mark-and-sweep strategies for garbage collection. Here’s a quick overview of how these work:
- Reference Counting: When an object is created, it is assigned a reference count. This count increases when another part of the program references the object. When no references remain, the object’s memory can be safely freed.
- Mark-and-Sweep: This is the more common method used in modern JavaScript engines. The garbage collector goes through all the objects in memory, “marks” those still in use (i.e., objects referenced by the app), and then “sweeps” away the objects that aren’t marked.
While this system works well for the most part, developers still need to be careful with how they manage memory to avoid situations where objects are unintentionally kept in memory due to mismanagement.
Common Causes of Memory Leaks in Front-End Frameworks
In the context of front-end frameworks like React, Angular, and Vue.js, memory leaks are often caused by the following common issues:
1. Event Listeners Not Removed:
When you attach event listeners (like click, resize, or scroll) to DOM elements, they remain active even if the element is removed from the page. If these event listeners aren’t properly detached when the component is unmounted, they can cause memory leaks.
Example: In React, if you add an event listener inside a component’s useEffect but forget to remove it in the cleanup function, the listener remains active, holding onto memory.
2. Unsubscribed Observables:
In frameworks like Angular, RxJS is often used for handling asynchronous operations. If an observable is subscribed to, but the subscription is never properly unsubscribed when the component is destroyed, it can hold a reference to the component and prevent it from being garbage collected.
Example: Not unsubscribing from observables in Angular’s ngOnDestroy lifecycle hook will cause the component to persist in memory longer than necessary.
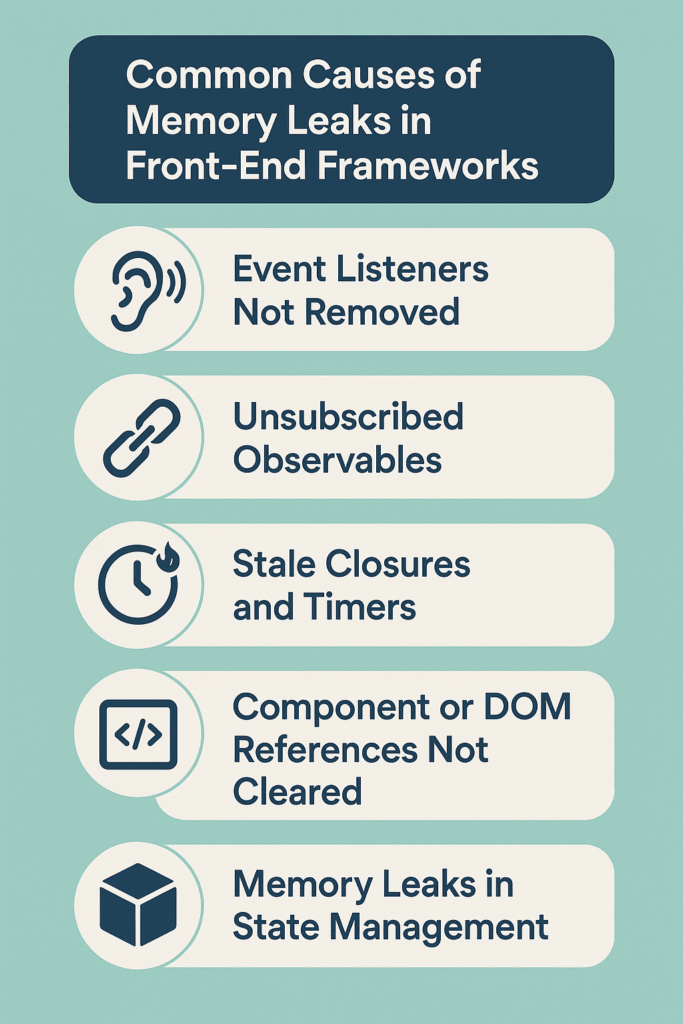
3. Stale Closures and Timers:
Closures, such as functions that maintain access to variables from their parent scope, can sometimes unintentionally retain references to objects that are no longer needed. Similarly, setTimeout or setInterval functions can cause memory leaks if they aren’t cleared properly, as they might keep references to objects within their scope.
Example: If a timer is set inside a React component and not cleared in the cleanup function, the component could still be holding onto memory even after it has unmounted.
4. Component or DOM References Not Cleared:
In frameworks like React, Angular, and Vue, components are often dynamically created and destroyed. If references to DOM elements or components are not properly cleared when they are no longer needed, these objects can remain in memory, leading to leaks.
Example: Storing DOM references in a variable and not cleaning them up when the component is removed from the DOM can cause a memory leak.
5. Memory Leaks in State Management:
Many modern front-end frameworks use state management libraries (like Redux, Vuex, or NgRx). If you don’t properly clean up state or handle subscriptions to state changes, you can end up with objects stuck in memory, especially if you keep adding items to global states without removing them when they are no longer required.
Example: In React, improper use of useState or useEffect hooks that trigger infinite state updates without cleanup can cause components to re-render unnecessarily and hold onto old state values, creating a memory leak.
Common Memory Leak Scenarios in Popular Frameworks
Memory leaks can happen in various forms across different JavaScript frameworks, but the underlying cause is usually the same: objects or resources are not properly cleaned up when no longer in use. Below, we’ll examine some common scenarios that can lead to memory leaks in three popular frameworks — React, Angular, and Vue.js.
React
1. Stale Closures and Lingering Event Listeners
One of the most common causes of memory leaks in React is when event listeners or handlers are attached to DOM elements but never removed when the component unmounts. This happens frequently when components use closures to access data or state values, but those closures keep references to variables that should have been cleaned up.
Example: If you use window.addEventListener inside a useEffect hook but forget to remove the event listener in the cleanup function, the listener remains active even after the component is unmounted, holding onto memory.
js
Copy
useEffect(() => {
const handleResize = () => {
// Do something with the window size
};
window.addEventListener(‘resize’, handleResize);
// Cleanup
return () => window.removeEventListener(‘resize’, handleResize);
}, []);
2. Forgetting to Clean Up Subscriptions or Timers
Another common issue in React is forgetting to clean up subscriptions (e.g., Redux, Firebase, WebSockets) or timers (setTimeout, setInterval) when components unmount. If these are not properly cleared, they will continue to hold references to the component and its state, causing memory to accumulate.
Example: If you set a setInterval in a useEffect but don’t clear it when the component unmounts, it will keep the component’s memory alive.
js
Copy
useEffect(() => {
const interval = setInterval(() => {
console.log(‘Running every 2 seconds’);
}, 2000);
// Cleanup
return () => clearInterval(interval);
}, []);
3. Improper Use of Refs or State Causing Retained Objects
Using React refs improperly can sometimes cause objects to be retained in memory. Refs are useful for directly interacting with DOM elements, but if they’re used to store large objects or if they’re not cleared after use, they can lead to memory leaks. Similarly, improper use of state (e.g., large state objects) without cleanup can cause the app to retain unnecessary data.
Example: Retaining references to large data objects or DOM elements in refs without clearing them in the cleanup function.
Angular
1. Unsubscribed Observables (RxJS)
Angular heavily relies on RxJS for handling asynchronous operations, and if you subscribe to an observable but forget to unsubscribe when the component is destroyed, it can cause a memory leak. Angular provides the ngOnDestroy lifecycle hook to clean up such subscriptions.
Example: Forgetting to unsubscribe from an observable in ngOnDestroy can keep the component and its resources in memory.
js
Copy
import { Subscription } from ‘rxjs’;
export class MyComponent implements OnInit, OnDestroy {
private subscription: Subscription;
ngOnInit() {
this.subscription = this.myService.getData().subscribe(data => {
// Handle data
});
}
ngOnDestroy() {
// Cleanup subscription
if (this.subscription) {
this.subscription.unsubscribe();
}
}
}
2. Detached DOM Nodes
In Angular, when dynamic DOM elements are added or removed, there is a risk that the DOM nodes are not fully cleaned up. This can happen, for example, when there are elements that are conditionally rendered and not properly disposed of, leaving them lingering in memory even after they are removed from the UI.
Example: Using *ngIf or *ngFor to dynamically render elements but not properly cleaning up the associated resources can lead to detached DOM nodes that are not garbage collected.
3. Heavy Use of Change Detection Causing Memory Bloat
Angular’s change detection mechanism checks the entire component tree for changes in every cycle. In large applications with many bindings or expensive computations, this can cause excessive memory usage. If not optimized, the constant tracking of changes can lead to memory bloat, especially if change detection is not properly managed.
Example: Overuse of ChangeDetectionStrategy.Default can lead to unnecessary checks on every component, consuming memory resources.
Vue.js
1. Unremoved Event Listeners
Similar to React, Vue.js allows you to bind event listeners to elements. If these listeners are not properly cleaned up when the component is destroyed, they can lead to memory leaks. This often happens when developers use custom event listeners and forget to remove them during component destruction.
Example: Attaching a custom event listener inside a Vue component without removing it during the beforeDestroy or destroyed lifecycle hook.
js
Copy
export default {
mounted() {
window.addEventListener(‘resize’, this.handleResize);
},
beforeDestroy() {
window.removeEventListener(‘resize’, this.handleResize);
},
methods: {
handleResize() {
// Handle window resize
}
}
};
2. Retained Component Instances
In Vue.js, when using dynamic components or v-if to conditionally render elements, there’s a risk that old component instances may not be properly destroyed. This happens when Vue does not properly clean up the component’s resources when it’s removed from the DOM.
Example: Improper cleanup of component instances when switching between components can cause them to persist in memory, leading to leaks.
3. Reactive Data Leaks
Vue.js uses a reactivity system where data is bound to the DOM. If you fail to manage the data properly, especially when using large or complex reactive objects, these objects may persist in memory. Reactive data leaks often occur when large objects are left untracked or when reactivity systems fail to dispose of them when no longer needed.
Example: Not clearing or cleaning up reactive data used across different components or events can result in unnecessary memory retention.
Tools and Techniques to Identify Memory Leaks
Identifying and fixing memory leaks can be a challenging task, especially in modern JavaScript frameworks that manage complex components and state. Fortunately, several tools and techniques can help developers detect memory leaks and gain insights into the performance of their applications. Below, we’ll dive into some of the most effective tools and methods for identifying memory leaks.
1. Using Chrome DevTools Memory Profiler
Chrome DevTools is one of the most powerful and widely used tools for diagnosing memory leaks in web applications. It provides several features for profiling memory usage, including the Memory tab, which allows you to inspect heap allocations, snapshots, and track potential memory issues.
Key Features:
- Heap Snapshots: Chrome DevTools lets you take heap snapshots that capture the state of memory at a particular point in time. These snapshots help you identify which objects are taking up the most memory and whether they are being properly garbage collected.
- Allocation Timelines: By recording the allocation timeline, you can track memory usage over time, identifying memory growth patterns and pinpointing moments when leaks occur.
How to use the Memory Profiler:
- Open DevTools (Right-click on your page > Inspect or press Ctrl + Shift + I).
- Go to the Memory tab.
- Choose between different profiling methods:
- Heap Snapshot: Allows you to capture a snapshot of the JavaScript heap and analyze memory allocation. This is useful for finding objects that are not being garbage collected.
- Allocation Instrumentation on Timeline: Tracks memory allocations over time and shows you where and when memory is allocated. It helps you observe the application’s memory behavior during user interaction.
- Garbage Collection: You can force a garbage collection (GC) cycle in DevTools to manually trigger cleanup and observe the remaining memory after garbage collection.
Example: If your heap snapshot shows that certain objects (such as event listeners or components) are not being released, you can investigate further and identify where the references to those objects are being retained.
2. Heap Snapshots and Allocation Timelines
Heap snapshots and allocation timelines are some of the most powerful ways to identify memory leaks and inefficiencies in your JavaScript application. Here’s an in-depth look at how both work:
- Heap Snapshots: A heap snapshot is essentially a memory dump at a particular moment in time. It provides detailed information about the memory allocations, including the objects in memory and the references between them. By comparing heap snapshots before and after specific actions (e.g., component mounting/unmounting or user interactions), you can identify objects that persist in memory unnecessarily.
- Allocation Timelines: The allocation timeline records memory usage over time as your application runs. It shows you how memory is allocated during specific interactions or actions and helps you spot trends in memory usage. This is especially useful for spotting gradual memory increases that lead to leaks. If you notice a steady increase without a corresponding decrease (as would happen after a garbage collection cycle), you might be dealing with a memory leak.
By analyzing both heap snapshots and allocation timelines, you can gain insights into which objects and components are causing memory bloat.
3. Performance Monitoring with Lighthouse and Other Tools
Google Lighthouse is an open-source, automated tool for improving the quality of web pages. It provides insights into various aspects of a webpage, including performance, accessibility, SEO, and more. Although it’s not a specialized memory profiling tool, Lighthouse can still be helpful in identifying performance bottlenecks that may be caused by memory leaks.
How Lighthouse Helps with Memory Leaks:
- Performance Audits: Lighthouse provides performance audits that give you a high-level view of your app’s performance. If there are memory-related issues affecting performance, Lighthouse can highlight potential areas for improvement.
- Long Tasks: If your app experiences long tasks (which may be caused by unoptimized memory usage), Lighthouse will flag these tasks in the report. This can help you identify situations where memory leaks or excessive memory usage might be contributing to performance problems.
- Consistency with Other Tools: Lighthouse integrates well with Chrome DevTools, and using them together can provide a more comprehensive view of memory usage and performance bottlenecks.
Other Tools for Performance Monitoring:
- WebPageTest: This tool offers deeper insights into web performance, including memory-related issues.
- Sentry: While Sentry is primarily an error-tracking tool, it also provides performance monitoring, helping you detect memory problems in production environments.
- New Relic: New Relic offers full-stack performance monitoring, including memory and CPU usage, which can help you identify memory leaks in real-time.
4. Third-Party Tools and Libraries for Memory Profiling
While Chrome DevTools is incredibly powerful, there are also several third-party tools and libraries available for more specialized or comprehensive memory profiling:
- Why Did You Render (for React): This tool helps developers track unnecessary re-renders, which can sometimes cause memory bloat. It highlights components that re-render too often, allowing developers to optimize performance.
- Heap.js: Heap.js is a JavaScript memory profiler that allows developers to track memory usage in Node.js applications. It provides detailed insights into memory allocation and helps developers detect memory leaks.
- Memwatch: Memwatch is another Node.js module that helps monitor memory usage over time. It tracks memory allocations and reports when objects are not being garbage collected as expected.
- Perfume.js: Perfume.js is a lightweight performance monitoring tool that tracks memory usage, performance metrics, and more. It is useful for monitoring memory leaks in real-time.
These third-party tools can complement Chrome DevTools by providing additional data and insights, especially for specific use cases or frameworks.
5. How to Interpret Memory Snapshots
When analyzing memory snapshots, the goal is to identify objects that are consuming memory without being freed. Here’s how you can interpret memory snapshots effectively:
- Look for Detached DOM Nodes: These are DOM elements that have been removed from the page but are still referenced by JavaScript, which prevents them from being garbage collected. They typically show up as “Detached” nodes in a heap snapshot.
- Analyze Object Retention: Check for objects that are being retained longer than necessary. Look for objects that appear in multiple snapshots and have increasing memory usage. These could be caused by event listeners, timers, or other references that are not properly cleaned up.
- Identify Unnecessary References: Pay attention to closures or state variables that are holding onto objects that should no longer be in use. For instance, if a component keeps a reference to an object in its state or a closure, and this object is never cleared, it will remain in memory even when the component is unmounted.
- Cross-Reference with Performance Data: If you notice excessive memory usage in a snapshot, check the performance timeline to see if it correlates with a particular user action or interaction. This can help you narrow down the cause of the memory leak.
- Check for Memory Increases: If you notice a steady increase in memory usage without a corresponding decrease (after a garbage collection cycle), this is a clear sign of a memory leak.
Step-by-Step Guide to Diagnosing Memory Leaks
Diagnosing memory leaks in web applications can be a bit tricky, but with the right tools and a structured approach, it becomes much easier. In this guide, we’ll walk you through a step-by-step process for identifying memory leaks in your JavaScript applications using Chrome DevTools. By following these steps, you will be able to systematically detect and fix memory issues that could impact your app’s performance.
1. Set Up Your Testing Environment
Before you start diagnosing memory leaks, it’s important to set up an appropriate testing environment. Here’s how to get started:
- Ensure Consistent Conditions: Make sure you are testing in a controlled environment. This means closing unnecessary browser tabs, disabling browser extensions that could interfere with the profiling, and testing in an environment that mimics your production setup.
- Use Chrome DevTools: For this guide, we’ll focus on using Chrome DevTools, as it’s the most commonly used tool for memory profiling in web applications. Make sure you’re using a stable version of Chrome to avoid inconsistencies in profiling data.
- Access the Application: Open your application in Chrome and make sure it is in a state where you can interact with it as a typical user would. If you’re testing a React app, for example, ensure that you’re interacting with the components that are most likely to cause memory issues.
2. Capture Baseline Heap Snapshot
A heap snapshot is a snapshot of the memory heap at a particular point in time. Taking a baseline snapshot helps you understand the current memory usage and gives you a reference point for comparing later snapshots.
- Open Chrome DevTools: Right-click anywhere on your page and select “Inspect” to open the DevTools. Alternatively, press Ctrl + Shift + I or Cmd + Opt + I (on macOS).
- Go to the Memory Tab: In the DevTools panel, go to the Memory tab. You’ll see options for “Heap Snapshot,” “Allocation Instrumentation on Timeline,” and “Garbage Collection.”
- Take the First Snapshot: Select the Heap Snapshot option and click the “Take Snapshot” button. This will capture the current state of your memory. It’s a good idea to name your snapshot (e.g., “Baseline”) to keep track of it.
This baseline snapshot will serve as the reference point to identify any memory growth as you interact with the application.
3. Perform Typical User Interactions
Now that you’ve captured the baseline snapshot, it’s time to simulate typical user interactions with your application. These interactions will be used to trigger memory allocations, such as component mounting, form submissions, clicks, or page navigations. These actions are often where memory leaks manifest.
- Interact with Key Features: Interact with the most important or complex parts of your application. This might include adding/removing items from a list, navigating between pages, or triggering specific components that might have issues (e.g., dynamically loaded content, event listeners, etc.).
- Simulate Real-World Usage: Try to use the application as an end user would, including common workflows. The goal is to engage with as many areas of the app as possible to see where memory usage increases over time.
Take note of any long-lasting or unusual interactions that could trigger leaks.
4. Capture Subsequent Snapshots and Compare
After performing user interactions, it’s time to capture more snapshots to track memory usage over time and compare them with the baseline.
- Take Additional Snapshots: After performing each set of interactions, go back to the Memory tab in Chrome DevTools and capture another Heap Snapshot. Give each snapshot a distinct name (e.g., “Post-Interaction 1,” “Post-Interaction 2”).
- Compare Snapshots: In the Heap Snapshot panel, you can compare the new snapshot to the baseline snapshot. Look for objects or memory allocations that were not present in the baseline but appear after interactions. You can also look at memory usage over time and see if it increases without ever going down.
If the memory usage is increasing steadily without being cleaned up, it could indicate that objects are not being released correctly, signaling a potential memory leak.
5. Look for Detached DOM Nodes and Retained Objects
One of the key indicators of memory leaks is detached DOM nodes. These are DOM elements that are no longer part of the document but are still being referenced by JavaScript. This can happen if you dynamically remove elements but fail to clean up event listeners or other references.
- Look for Detached DOM Nodes: In the Heap Snapshot, look for objects labeled as “Detached” in the Object Retainers section. These are the nodes that have been removed from the DOM but are still being held in memory.
- Identify Retained Objects: Review any objects that appear to be retained in memory even though they are no longer in use. These could include event listeners, components, or closures that are holding onto memory unnecessarily.
In the Retainers section of the snapshot, you can see which other objects are holding onto memory. This helps you identify what’s causing the retention and which parts of the application might be leaking memory.
6. Identify Suspicious Patterns and Their Sources
Once you’ve compared snapshots and identified potential memory leaks, the next step is to analyze suspicious patterns and track down their sources. Look for consistent memory growth over time or objects that continue to exist after they should have been cleared.
- Analyze Retained References: Pay attention to which objects or functions are causing memory retention. For example, event listeners that aren’t properly removed, asynchronous callbacks that are not cleaned up, or components that aren’t unmounted properly may be causing memory leaks.
- Trace Back to the Source: In the Heap Snapshot, the “Retainers” section can show you which objects are holding references to the problematic objects. Tracing these references back to their source in your code will help you identify where the memory leak originates.
For example, if you notice that an event listener is causing memory retention, you can track it down to the specific component or code that added it and make sure it’s properly removed during component cleanup.
Conclusion: Fixing the Leak
Once you’ve identified the root cause of the memory leak, it’s time to fix it. Common fixes include:
- Properly removing event listeners when components unmount.
- Ensuring subscriptions to observables are properly unsubscribed.
- Using proper component cleanup in the framework’s lifecycle methods (e.g., componentWillUnmount in React, ngOnDestroy in Angular).
- Ensuring that references to DOM nodes and other objects are removed when they are no longer needed.
After applying your fixes, repeat the process of taking heap snapshots and comparing them to ensure that the leak has been resolved. Over time, you’ll develop a strong habit of identifying and fixing memory leaks before they impact your application’s performance.
Best Practices to Fix Memory Leaks
Memory leaks can significantly degrade the performance and reliability of your web application, especially as it grows in size and complexity. Fortunately, there are several best practices that you can follow to prevent and fix memory leaks in popular JavaScript frameworks like React, Angular, and Vue. By adopting these practices, you can ensure that your application runs smoothly and efficiently.
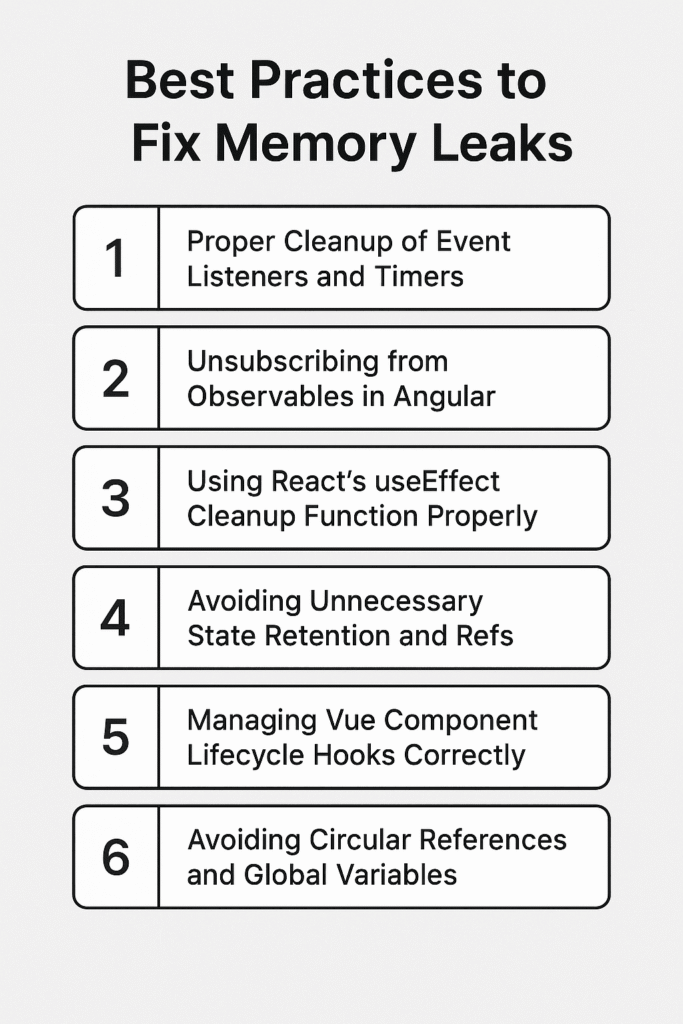
1. Proper Cleanup of Event Listeners and Timers
Event listeners and timers (e.g., setTimeout, setInterval) are common sources of memory leaks if they are not properly cleaned up when no longer needed. They can keep references to objects, including DOM elements and functions, and prevent garbage collection.
- Event Listeners: Always remove event listeners when components are unmounted or when they are no longer needed. This applies to both native DOM events and custom events.
Example (React):
js
Copy
useEffect(() => {
const handleResize = () => {
// Handle window resizing
};
window.addEventListener(‘resize’, handleResize);
// Cleanup event listener when component unmounts
return () => window.removeEventListener(‘resize’, handleResize);
}, []);
- Timers: If you use setTimeout or setInterval in your components, always clear them when the component is unmounted to prevent them from holding references to memory.
Example (React):
js
Copy
useEffect(() => {
const intervalId = setInterval(() => {
console.log(‘Running every 1 second’);
}, 1000);
// Cleanup timer when component unmounts
return () => clearInterval(intervalId);
}, []);
By ensuring proper cleanup of event listeners and timers, you free up memory that would otherwise be retained by unused objects.
2. Unsubscribing from Observables in Angular
In Angular, memory leaks often occur when subscriptions to observables are not properly unsubscribed when a component is destroyed. Observables continue to emit data, and if subscriptions are left active, they can retain references to the component, leading to a memory leak.
- Unsubscribe in ngOnDestroy: Always unsubscribe from observables in the ngOnDestroy lifecycle hook to ensure that subscriptions are properly cleaned up.
Example (Angular):
js
Copy
import { Subscription } from ‘rxjs’;
export class MyComponent implements OnInit, OnDestroy {
private subscription: Subscription;
ngOnInit() {
this.subscription = this.myService.getData().subscribe(data => {
// Handle incoming data
});
}
ngOnDestroy() {
// Unsubscribe when the component is destroyed
if (this.subscription) {
this.subscription.unsubscribe();
}
}
}
Alternatively, you can use operators like takeUntil to automatically unsubscribe when the component is destroyed, reducing the risk of memory leaks.
3. Using React’s useEffect Cleanup Function Properly
React’s useEffect hook allows you to run side effects in your components, such as data fetching or setting up event listeners. However, if you don’t clean up these side effects when the component unmounts, it can lead to memory leaks.
- Cleanup in useEffect: Always return a cleanup function inside the useEffect hook to clean up resources (event listeners, subscriptions, timers, etc.) when the component unmounts.
Example (React):
js
Copy
useEffect(() => {
// Perform some side effect, e.g., fetching data
const fetchData = async () => {
const response = await fetch(‘https://api.example.com/data’);
const data = await response.json();
setData(data);
};
fetchData();
// Cleanup function to cancel the request if the component unmounts
return () => {
// Clear timers, unsubscribe, or cancel any active operations
console.log(‘Cleaning up’);
};
}, []); // Empty dependency array means this effect runs once
Using this cleanup function correctly ensures that any side effects that could cause memory leaks are cleaned up when the component is no longer needed.
4. Avoiding Unnecessary State Retention and Refs
Excessive or unnecessary retention of state and refs in React can contribute to memory leaks, especially when large objects are stored in state or refs and are not cleared when no longer needed.
- Avoid Storing Large Objects in State: When possible, avoid storing large objects, arrays, or data structures in the component’s state unless absolutely necessary. Store only the data that is required for rendering.
- Properly Clear Refs: If you use refs to store DOM elements or other objects, make sure they are cleared when they are no longer needed. Refs should not hold onto memory unnecessarily.
Example (React):
js
Copy
const myRef = useRef(null);
useEffect(() => {
// Assign ref value
myRef.current = someValue;
// Cleanup function to clear ref when component unmounts
return () => {
myRef.current = null; // Clear ref
};
}, []);
By avoiding unnecessary retention of state and clearing refs when no longer needed, you prevent memory from being unnecessarily held in your app.
5. Managing Vue Component Lifecycle Hooks Correctly
Vue.js provides lifecycle hooks that are similar to React’s lifecycle methods. Properly managing these hooks ensures that your components clean up resources and avoid memory leaks.
- Use beforeDestroy or destroyed for Cleanup: In Vue, you can use the beforeDestroy or destroyed lifecycle hooks to perform cleanup tasks, such as removing event listeners, cancelling network requests, or unsubscribing from observables.
Example (Vue):
js
Copy
export default {
mounted() {
window.addEventListener(‘resize’, this.handleResize);
},
beforeDestroy() {
// Clean up event listener before component is destroyed
window.removeEventListener(‘resize’, this.handleResize);
},
methods: {
handleResize() {
console.log(‘Window resized’);
}
}
};
By properly managing the lifecycle hooks, you ensure that resources are cleaned up and memory is freed when the component is destroyed.
6. Avoiding Circular References and Global Variables
Circular references occur when two or more objects reference each other, creating a cycle. This can prevent the garbage collector from cleaning them up because they are still technically being referenced. Similarly, global variables can persist for the life of the application, consuming memory unnecessarily.
- Avoid Circular References: Always check for circular references, especially when dealing with complex objects. These references can prevent objects from being garbage collected.
- Avoid Global Variables: Minimize the use of global variables, as they remain in memory for the entire lifetime of the application. If global state is necessary, consider using state management libraries like Redux or Vuex to manage state in a more controlled manner.
Example:
js
Copy
// Circular reference example
const objA = {};
const objB = { a: objA };
objA.b = objB; // Circular reference
// Fix: Avoid circular references to ensure proper memory cleanup
By avoiding circular references and reducing global variables, you make it easier for the garbage collector to clean up memory and prevent leaks.
Case Study / Example: Fixing a Memory Leak in React
In this case study, we will walk through a simple example of a memory leak in a React application. We will also demonstrate how to detect the leak using Chrome DevTools and explain how to fix it step-by-step.
Example of a Memory Leak in React
Let’s start with a simple React component that adds an event listener to track the window’s resize event. The problem here is that the event listener is never removed when the component unmounts, which leads to a memory leak.
jsx
Copy
import React, { useState, useEffect } from ‘react’;
const WindowResizeComponent = () => {
const [windowWidth, setWindowWidth] = useState(window.innerWidth);
useEffect(() => {
const handleResize = () => {
setWindowWidth(window.innerWidth);
};
// Adding event listener for window resize
window.addEventListener(‘resize’, handleResize);
// No cleanup function to remove the event listener (memory leak)
}, []); // Empty dependency array means this effect runs only once, on mount
return (
<div>
<h1>Window Width: {windowWidth}</h1>
</div>
);
};
export default WindowResizeComponent;
In this example, the component listens for resize events and updates the windowWidth state. However, the resize event listener is never removed, which means it will remain active even after the component is unmounted. This can lead to a memory leak, especially in cases where this component is frequently mounted and unmounted.
How to Detect the Memory Leak Using DevTools
To detect the memory leak, we will use Chrome DevTools.
Steps to detect the memory leak:
- Open Chrome DevTools: Right-click on the page and select Inspect or press Ctrl + Shift + I (or Cmd + Opt + I on macOS) to open DevTools.
- Go to the Memory Tab: In the DevTools panel, go to the Memory tab.
- Capture a Heap Snapshot: Click on Heap Snapshot and then click on Take Snapshot. This will capture the current state of memory.
- Perform Actions: Now, interact with your app by mounting and unmounting the WindowResizeComponent multiple times (for example, by navigating between pages or toggling visibility).
- Take Subsequent Snapshots: After interacting with the app, take additional heap snapshots. Pay attention to any objects that are increasing in size and not being freed.
- Look for Detached DOM Nodes or Event Listeners: In the snapshot, check for detached DOM nodes or objects that are still being retained, such as event listeners. If the memory usage continues to increase without being cleaned up, this suggests a memory leak.
What to look for:
- Detached DOM nodes: These are DOM elements that were removed from the page but are still being held in memory by JavaScript references.
- Retained event listeners: Event listeners that are still active but should have been cleaned up when the component unmounted.
If you observe these patterns, it means the event listeners are not being removed properly, and the memory is not being freed.
How to Fix the Memory Leak Step-by-Step
To fix the memory leak, we need to properly clean up the event listener when the component is unmounted. In React, you can do this by returning a cleanup function inside the useEffect hook.
Here’s how to fix it:
jsx
Copy
import React, { useState, useEffect } from ‘react’;
const WindowResizeComponent = () => {
const [windowWidth, setWindowWidth] = useState(window.innerWidth);
useEffect(() => {
const handleResize = () => {
setWindowWidth(window.innerWidth);
};
// Adding event listener for window resize
window.addEventListener(‘resize’, handleResize);
// Cleanup function to remove event listener when the component unmounts
return () => {
window.removeEventListener(‘resize’, handleResize);
};
}, []); // Empty dependency array means this effect runs only once, on mount
return (
<div>
<h1>Window Width: {windowWidth}</h1>
</div>
);
};
export default WindowResizeComponent;
Explanation of the Fix:
- Cleanup Function: Inside the useEffect hook, we added a cleanup function that removes the event listener when the component unmounts. This ensures that the event listener is properly cleaned up and does not cause a memory leak.
js
Copy
return () => {
window.removeEventListener(‘resize’, handleResize);
};
- Effect Dependency Array: The empty dependency array ([]) ensures that this effect runs only once, when the component mounts, and not on every render. This is important for performance and prevents unnecessary side effects.
Verifying the Fix
After making this fix, you can verify that the memory leak has been resolved:
- Take New Heap Snapshots: After implementing the cleanup function, repeat the steps to capture heap snapshots in Chrome DevTools.
- Mount and Unmount the Component: Interact with the app again by mounting and unmounting the component multiple times.
- Check for Detached DOM Nodes: This time, when you take snapshots, there should be no retained event listeners or detached DOM nodes. The memory should not increase without being cleaned up.
By ensuring proper cleanup in the useEffect hook, the event listener is removed when the component is unmounted, and the memory is freed, resolving the memory leak.
Preventing Memory Leaks in Future Projects
Memory leaks can become a significant problem in any long-running web application, especially as the app grows in size and complexity. However, by following coding best practices, conducting regular audits, utilizing automated tools, and educating your development team, you can proactively prevent memory leaks and ensure that your app remains efficient and performant throughout its lifecycle. Let’s dive into these key strategies to prevent memory leaks in future projects.
1. Coding Best Practices
One of the most effective ways to prevent memory leaks is by adopting sound coding practices that ensure efficient memory management from the start. Here are some best practices you should follow:
- Proper Cleanup: Always clean up event listeners, timers, and subscriptions when they are no longer needed. In React, Angular, and Vue, this means properly handling lifecycle methods/hooks such as componentWillUnmount, ngOnDestroy, and the useEffect cleanup function.
- React: Ensure that you remove event listeners and clean up timers or subscriptions in the cleanup function of useEffect.
- Angular: Use ngOnDestroy to unsubscribe from observables and clean up resources.
- Vue: Use lifecycle hooks like beforeDestroy or destroyed to clean up event listeners or other resources.
- Avoid Global Variables: Global variables persist throughout the lifetime of an application and can lead to memory retention. Minimize the use of global state and variables, and instead, use state management tools like Redux, Vuex, or NgRx to control application state.
- Limit Large Data Structures in State: Storing large objects or arrays in component state can lead to memory bloat, especially if the data is not cleaned up. Keep state as lean as possible and avoid holding onto data that is not required for rendering.
- Use Weak References When Possible: If you need to hold onto references but don’t want to risk a memory leak, consider using weak references (e.g., WeakMap, WeakSet) in JavaScript. These allow objects to be garbage collected when they are no longer in use.
- Avoid Circular References: Circular references, where two or more objects reference each other, can prevent the garbage collector from freeing memory. Be cautious with complex object structures and avoid unnecessary circular references.
2. Regular Performance and Memory Audits
Regular audits of your application’s performance and memory usage are critical for detecting memory leaks early. By making performance profiling a routine task, you can catch issues before they grow into larger problems.
- Use DevTools Regularly: Chrome DevTools provides powerful tools for monitoring memory usage and detecting leaks. Schedule periodic checks using the Memory tab to monitor heap snapshots, object allocations, and event listeners. By comparing snapshots over time, you can spot issues and take corrective actions early.
- Lighthouse Audits: Use tools like Lighthouse to run regular performance audits of your web application. Lighthouse can identify performance bottlenecks, including memory-related issues, and provide suggestions on how to optimize the app.
- Analyze Memory Usage Over Time: Track how memory usage evolves over time, particularly during high-traffic periods or after specific interactions. This can help detect gradual memory growth, indicating potential leaks.
- Automated Performance Tests: Integrate automated performance tests into your development workflow to continuously monitor memory usage. These tests can be used to measure performance regressions and identify unexpected memory increases that may signal leaks.
3. Using Automated Tools in CI/CD Pipelines
Integrating memory leak detection into your CI/CD (Continuous Integration / Continuous Deployment) pipeline can help catch potential issues early in the development lifecycle. By automating memory profiling, you can prevent leaks from reaching production and ensure your application remains efficient as it evolves.
- Automated Performance Tests: Set up automated performance and memory tests as part of your CI/CD pipeline. Tools like Jest, Mocha, and Karma can be extended to include memory testing, ensuring that the app’s memory usage is within acceptable limits during each build.
- Static Analysis Tools: Use static analysis tools like ESLint or SonarQube to enforce coding best practices related to memory management. These tools can help detect patterns that could lead to memory leaks, such as missing cleanup in lifecycle methods or improper management of event listeners.
- Browser Testing Automation: Integrate browser testing tools like Puppeteer or Cypress into your CI pipeline to simulate user interactions and check for performance issues, including memory leaks, during automated tests.
- Automated Profiling: Set up automated memory profiling during your build process. Tools like Google Lighthouse or WebPageTest can be incorporated into your CI/CD pipeline to regularly assess memory usage and highlight any significant changes or regressions.
4. Educating the Development Team
One of the most important aspects of preventing memory leaks is educating your development team about best practices for memory management. Developers need to understand the importance of efficient memory usage and how to avoid common pitfalls that lead to leaks.
- Training on Framework-Specific Practices: Ensure your team is well-versed in framework-specific techniques for memory management. For example:
- React: Educate your team on using the useEffect cleanup function and useRef to prevent unnecessary re-renders and memory retention.
- Angular: Teach your team how to properly unsubscribe from observables and clean up event listeners in lifecycle hooks like ngOnDestroy.
- Vue: Ensure that developers understand how to manage the Vue component lifecycle and handle resource cleanup effectively.
- Code Reviews for Memory Management: Make memory management a part of your code review process. Encourage team members to check for proper cleanup of event listeners, subscriptions, and other resources in their code.
- Shared Guidelines: Create a shared set of guidelines and best practices for memory management that all team members can reference. This should include proper cleanup techniques, how to avoid global variables, and the importance of avoiding circular references.
- Performance and Memory Leak Awareness: Educate your team about the importance of performance profiling and the tools available (e.g., Chrome DevTools, Lighthouse) to help them spot memory leaks and improve application performance.
- Ongoing Learning: Keep the team up-to-date on the latest developments in JavaScript performance and memory management. Encourage ongoing learning through workshops, conferences, and blog posts focused on memory leak prevention.
Conclusion
Memory leaks are a critical issue that can negatively impact the performance, scalability, and user experience of your web applications. Detecting and fixing memory leaks early ensures that your applications run efficiently, maintain smooth performance, and offer a better user experience over time. In this guide, we’ve walked through the importance of identifying memory leaks, how to detect them using powerful tools like Chrome DevTools, and the best practices to follow in React, Angular, and Vue to prevent them.
Recap: Importance of Memory Leak Detection and Fixing
Memory leaks, if left unchecked, can slowly degrade your app’s performance, causing slow rendering, lag, and even crashes in severe cases. As applications grow in size and complexity, managing memory becomes increasingly important. Detecting and fixing memory leaks ensures your app remains responsive, scalable, and reliable, which is essential for retaining users and maintaining a positive user experience.
Encouragement to Adopt Best Practices
To prevent memory leaks in future projects, it’s crucial to adopt the best practices we’ve discussed:
- Clean up event listeners, timers, and subscriptions when components are unmounted.
- Use appropriate lifecycle methods and hooks in frameworks like React, Angular, and Vue to ensure proper resource management.
- Regularly monitor memory usage with tools like Chrome DevTools and Lighthouse.
- Automate memory profiling in your CI/CD pipeline to catch issues early in the development process.
- Educate your team on memory management best practices and make it a part of the development culture.
By adopting these practices, you can ensure that your codebase remains clean, your applications run smoothly, and you avoid performance issues caused by memory leaks.
Final Tips and Resources for Further Learning
- Read Documentation: Refer to the official documentation of React, Angular, and Vue for more in-depth information on lifecycle methods and resource management.
- React Docs: useEffect Hook
- Angular Docs: Lifecycle Hooks
- Vue Docs: Lifecycle Hooks
- Performance Optimization Guides: Explore performance optimization techniques specific to JavaScript and front-end frameworks to further enhance your app’s efficiency.
- Google Web Fundamentals: Performance
- Web.dev Performance Tips
- Memory Profiling Tools: Familiarize yourself with other memory profiling tools such as WebPageTest, New Relic, and Sentry to keep track of memory usage in production environments.
- Books & Courses: Consider investing time in learning more about performance optimization and memory management through books and online courses. Some recommendations include:
- “JavaScript: The Good Parts” by Douglas Crockford
- “High-Performance Browser Networking” by Ilya Grigorik (available online)
- Courses on Udemy and Pluralsight that cover performance profiling and debugging.
By continuously applying these practices and learning from available resources, you’ll be well-equipped to handle memory management challenges, ensuring that your applications deliver high performance and an excellent user experience.
Disclaimer: The code examples provided in this article are for educational purposes and may not be fully optimized for all use cases. They are intended to demonstrate common patterns and techniques for detecting and fixing memory leaks in JavaScript frameworks. Depending on your specific project requirements, additional adjustments or improvements may be necessary. Always test and adapt the code to fit the needs of your application before implementing it in a production environment.